How to read candlestick charts
Candlestick chart
If you are studying technical analysis of stock, somewhere you probably heard name of candlestick charts. Candlestick charts may help you to decide entry and exit timing in any stock. Candlestick charts are generally used to analyze the possible future movement in stock price according to some kind of patterns formed in past.
How to read candlestick charts
What is candlestick chart?
As the name suggests, candlestick charts are formed by many candles. One candle is formed in specific timeframe (say for one trading day) and shows total four prices; open, close, high and low.
Now if we observe the stock price during whole day, at the end of trading day, we get four prices. Open price means the price at which the stock opens in morning. Close price indicates the closing of that stock at the end of day. High and low prices indicates the highest and lowest price achieved respectively by the stock during the day.

How to read candlestick charts
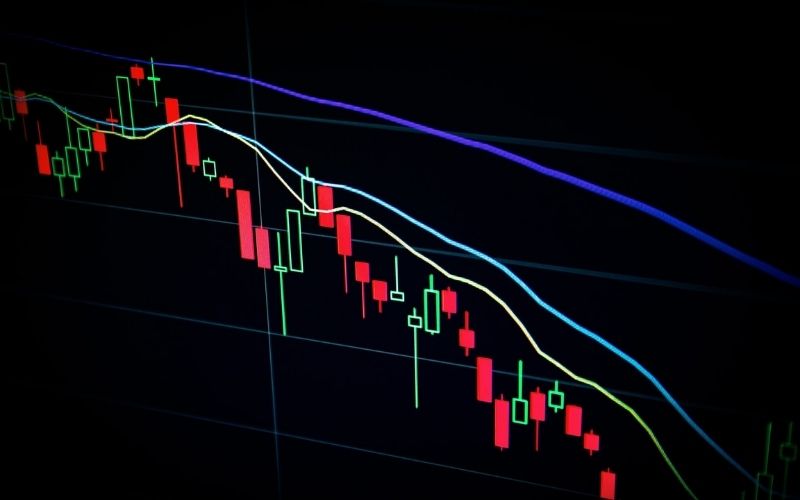
Now let’s look towards one candle formed in specific timeframe (Again assume for one day). The above picture shows many red and green candles. Look at any candle in this picture. The candle has rectangular body. This body is made by open and close price.
Now observe the vertical lines on top and bottom of body. The upper shadow (also known as wick of candle) indicates highest price of stock during the day. Similarly lower shadow (also known as tail) shows lowest price of the stock during the day.
When the colour of body is black the close price is lower than open price. When the body is empty, the close price is higher than open price. Instead of black and white, red and green colour respectively may also use to show above mentioned prices.
Body of candle may be long or short and shadows also may be long or short according to movement of stock prices during this timeframe. During volatile market, high and low prices of stock may far apart from each other and so candle formed on that day shows long wick and tail.
How to analyze candlestick chart
Before analyzing candlestick chart, we will see what is bullish candle and bearish candle?
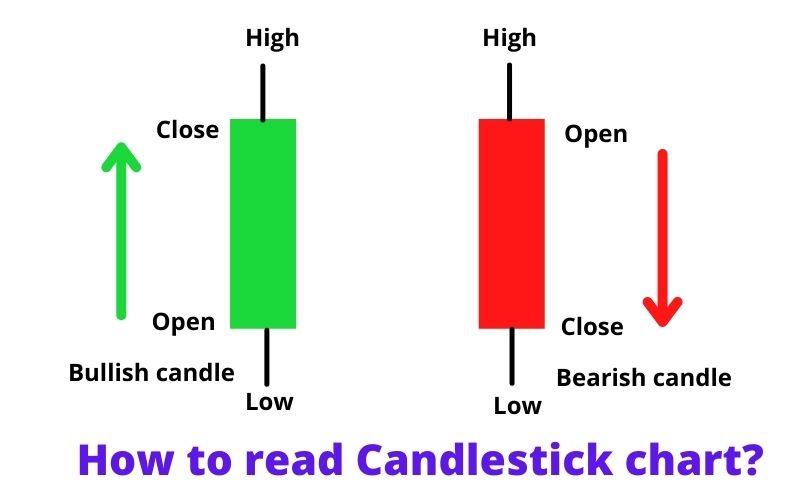
We will see the red and green candles for this understanding. The below shown image has one red candle and one green candle with their open, high, low and close prices.
When the body of candle is red (close is lower than the open), the candle is known as bearish candle. When we study this candle, we know that initially stock opens at some price but then bears take control of the trade and pushed down the stock price. Finally candle closes at lower price than its opening price.
How to read candlestick charts?

But when the body of candle is green (close is higher than the open), such candle is known as bullish candle. If we observe this bullish candle we can say after opening of stock, bulls take control of the trade and pushed up stock price. Finally stock price closes higher than opening price.
Now look at the vertical lines above and below the body. As discussed already these vertical lines are known as wicks and tails or upper shadows and lower shadows.
How to read candlestick charts?
In case of bullish candle (where closed price is higher than opened price) if upper shadow is enough long it means before closing the candle, stock price was reached further high than closed price.
But if the upper shadow is very close to body, we can say the closed price of the stock is almost near to the high price of the stock for that day. This behavior can also be applicable to bearish candles where a long lower shadow indicates that the stock had touched a further low price before the closing of the stock.
By using candlestick charts, an investor can decide his entry or exit in any stock or index.
What is the benefit of a candlestick chart?
How do you interpret a candlestick chart?
You may like to read: Stocks to Riches